What's K-line
K-line, also known as a candlestick chart, is a chart marked with the opening price, closing price, highest price, and lowest price to reflect price changes. It is said that the K-line was invented by a Japanese rice trader called Honma. Today, K-line is widely used in technical analysis in markets such as stocks, futures, and cryptos.
Basics of K-line
1. Composition
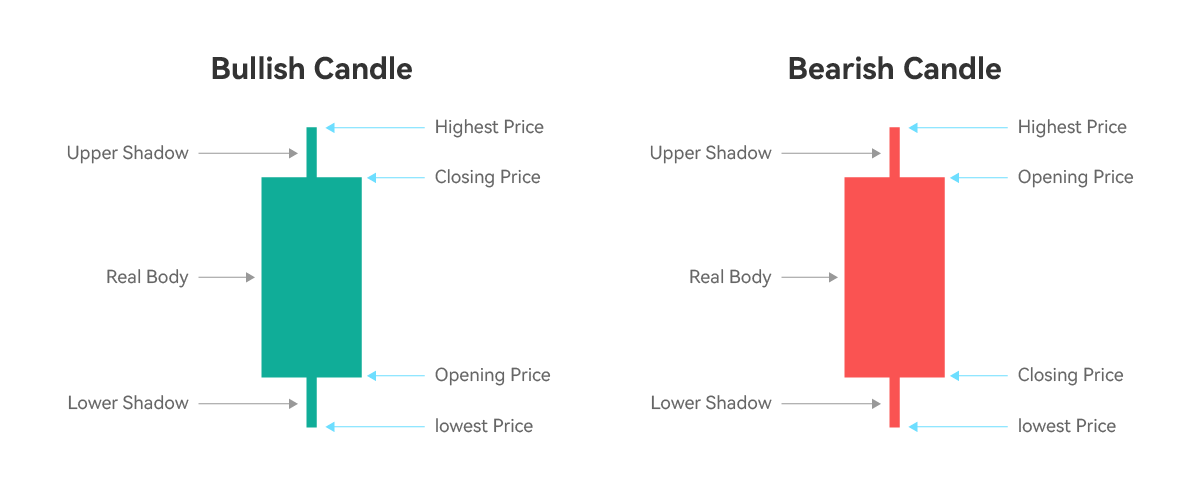
The K-line is composed of two parts, the shadow, and the real body. The rectangle in the middle is called the real body. The thin line above the real body is called the upper shadow, and the one below is called the lower shadow.
2. Elements
(1) Opening price: The first transaction price of the asset within a certain time frame.
(2) Closing price: The last transaction price of the asset within a certain time frame.
(3) Highest price: The highest transaction price of the asset within a certain time frame.
(4) Lowest price: The lowest transaction price of the asset within a certain time frame.
3. Bullish Candle and Bearish Candle
Bullish Candle: On CoinEx, the bullish candle is a green candle that represents the closing price is higher than the opening price.
Bearish Candle: On CoinEx, the bearish candle is a red candle that represents the closing price is lower than the opening price.
Usage of K-line
K-line is a visual analytical tool that not only reflects the changes in asset prices, but also the fluctuations in the markets.
It records the trading process and results between long and short traders within a certain time frame. If traders study the K-line patterns and analyze the changes in crypto price through the comparison of long and short strengths, coupled with sufficient practical experience, their winning rate may be higher than other traders.
However, price changes are affected by comprehensive factors and market prices may lag. It is not enough to just look at the K-line. Other technical analysis should be taken into account as well.